Huge Decline in Medicare Laboratory Testing Due to COVID-19
According to a recent OIG report, fewer Medicare Part B beneficiaries received lab tests during the first 10 months of the pandemic.

Fewer Medicare Part B beneficiaries received laboratory tests during the first 10 months of the COVID-19 pandemic. Utilization declined for all laboratory tests as well as tests associated with chronic conditions common among Medicare beneficiaries, including diabetes, kidney disease and heart disease. That is the unsurprising but troubling conclusion of a new U.S. Department of Health and Human Services Office of Inspector General (OIG) report published on November 9, 2022.1
The Pandemic and Medicare Laboratory Testing
This is hardly the first time that the OIG has focused its sights on how the COVID-19 pandemic has affected Medicare laboratory testing patterns. On December 30, 2021, the agency issued a report finding that while overall Medicare Part B spending on clinical laboratory testing during the initial pandemic year of 2020 increased by $300 million to $8.0 billion, $1.5 billion of that money was spent on COVID-19 tests that did not even exist in 2019, including $1.0 billion on rapid tests.2
At the same time, spending on non-COVID tests during the year was down by about $1.2 billion. While partly due to the Medicare Part B Clinical Laboratory Fee Schedule (CLFS) implemented under the Protecting Access to Medicare Act (PAMA) at the start of the year, the OIG found that testing decreased. Simply put, Medicare beneficiaries received far fewer non-COVID laboratory tests in 2020.
The OIG Report Findings
The new report delves deeper into this situation, focusing not on spending but actual test utilization. To carry it out, the OIG audited Medicare Part B claims for laboratory tests reimbursed under the CLFS from the pre-pandemic period of March through December 2019 and during those same 10 months during the pandemic year of 2020 (the “pandemic period”). According to the OIG:
-
- During the pre-pandemic period, Medicare spent a total of $6.6 billion for 419.9 million laboratory tests received by 26.1 million beneficiaries;
-
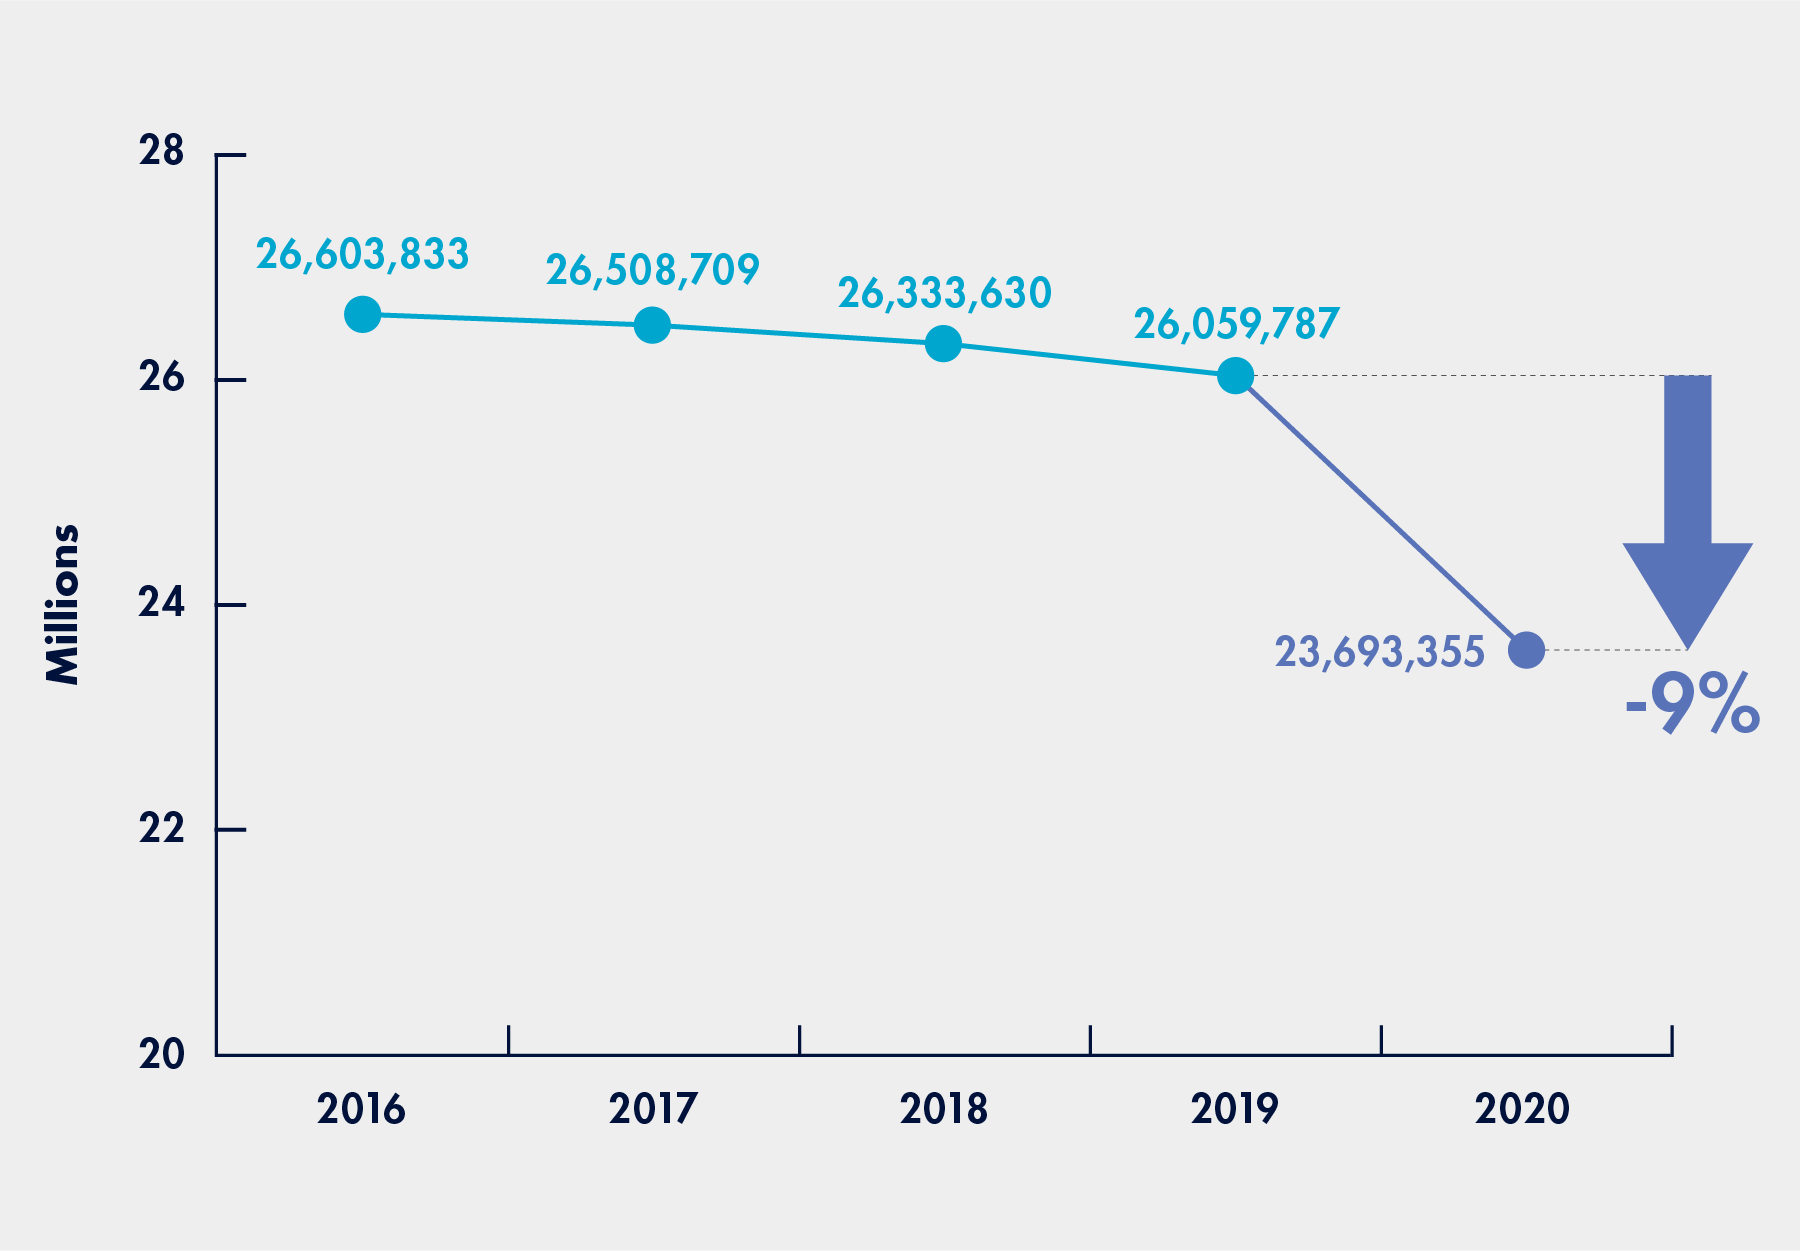
- During the pandemic period, Medicare spent a total of $5.5 billion for 358.4 million laboratory tests received by 23.7 million beneficiaries.
In other words, during the pandemic period, Medicare spending decreased by about 16 percent, tests decreased by about 15 percent, and beneficiaries tested declined by about 9 percent, as compared to the pre-pandemic period. In both periods, more than 75 percent of all Part B beneficiaries received laboratory tests. As noted above, during the pandemic period, the number of Part B beneficiaries receiving laboratory tests decreased for both all laboratory tests and tests for chronic medical conditions.
Figure 1: Decreases in the Number of Beneficiaries Who Received Lab Tests
(March to December Period for 2016 to 2020)

Based on the analysis, the report identifies five trends:
-
- The number of beneficiaries who received tests had the highest percentage decreases during the first three months of the pandemic period when compared with the same months during the pre-pandemic period;
-
- Of the tests that declined during the pandemic period, almost 90 percent experienced a drop in the number of receiving beneficiaries of more than 10 percent;
-
- In terms of gender and residential location, i.e., rural or urban demographics, during the pandemic period, the number of beneficiaries who received laboratory tests had similar percentage decreases for each category within the corresponding demographic—thus, for example, “the female and male genders had similar percentage decreases”;
-
- In terms of the race or ethnicity group demographic, “during the pandemic period, there was more variation in the percentage decreases in the number of beneficiaries who received laboratory tests for each category”—thus, for example, “the Hispanic or Latino category had a higher percentage decrease than the White category”; and
-
- “The number of beneficiaries with diabetes, kidney disease, and heart disease who received common laboratory tests for those conditions decreased during the pandemic period,” with the COVID-19 pandemic likely contributing to these decreases.
Takeaway
The declines in Medicare laboratory test utilization during the pandemic period are disturbing, particularly the decreases in tests for diabetes, kidney disease, and heart disease. These are chronic medical conditions commonly found in the elderly populations Medicare is designed to protect. “When these conditions are not well managed with lab tests, medications, diets, or lifestyle changes, they may lead to use of high-cost health services, increased Medicare spending, poor health outcomes or death, and, during the COVID-19 pandemic, an increased risk of developing severe illness if a person has COVID-19,” the OIG report cautions. “Because these conditions persist for an extended period and, in many cases, cannot be cured, lab tests used for screening for and monitoring these conditions (e.g., the blood test that measures the hemoglobin A1C level for those with diabetes and various blood tests for those with kidney disease) can play an important role in improving health outcomes and controlling future health care costs.”
Figure 2. Top 10 Laboratory Tests with More Than 10-Percent Decrease in Number of Beneficiaries Receiving the Tests (Based on the Number of Beneficiaries Who Received the Tests During the Pre-Pandemic Period)
| Lab Test (CPT Code) | No. of Beneficiaries Who Received Test (Mar.–Dec. 2019) |
No. of Beneficiaries Who Received Test (Mar.–Dec. 2020) |
Difference | Percentage Change |
| Blood test, basic group of blood chemicals (80048)* |
5,923,982 | 4,870,775 | -1,053,207 | –18% |
| Manual urinalysis test with examination using microscope (81001) |
5,350,459 | 4,664,731 | -685,728 | –13% |
| Automated urinalysis test (81003) |
4,091,396 | 3,433,975 | -657,421 | –16% |
| Cyanocobalamin (vitamin B-12) level (82607) |
3,871,157 | 3,435,130 | -436,027 | –11% |
| Complete blood cell count (red cells, white blood cell, platelets), automated test (85027) |
3,692,125 | 3,210,253 | -481,872 | –13% |
| Bacterial colony count, urine (87086) |
3,672,365 | 3,084,389 | -587,976 | –16% |
| Uric acid level, blood (84550) |
2,193,956 | 1,915,523 | -278,433 | –13% |
| Evaluation of antimicrobial drug (antibiotic, antifungal, antiviral) (87186) |
2,110,618 | 1,745,842 | -364,776 | –17% |
| Folic acid level (82746) | 1,975,142 | 1,731,987 | -243,155 | –12% |
| Urinalysis, manual test (81002) |
1,956,054 | 1,416,689 | -539,365 | –28% |
References:
Subscribe to Clinical Diagnostics Insider to view
Start a Free Trial for immediate access to this article